
Market Strategy
by Talley Leger, Chief Market Strategist
July 2, 2026
Market Memory: What Past Performance Implies About Future Results
Every investment professional – including me – is familiar with the ubiquitous compliance disclaimer: “Past performance does not guarantee future results.” While it’s intended to protect market participants from dangerous extrapolation, that legal warning has unintentionally fostered a narrative that stock market history is nothing but a “random walk” with zero explanatory power.
To be clear, the purpose of this fun summer Flash is to refine, not challenge, the interpretation of the compliance disclaimer. In that spirit, nearly a century of experience suggests that past returns on US large market capitalization stocks contain a faint yet statistically significant signal that may help explain how share prices evolve over time.
Ubiquitous Disclaimer vs. Historical Reality
Do the past 12 months of performance influence this month’s return? To answer that question, I built a standard log-log Autoregressive Model – an AR(12) specification – using the natural logarithm of month-over-month (M/M) price ratios on the S&P 500 from January 1929 to June 2026 (i.e., 1,170 months). Price ratios solve the negative return problem with log transformations.
Empirical Framework
To avoid the illusion of “spurious” regressions caused by the long-term uptrend of the S&P 500, I transformed the raw index levels into logged, stationary, continuously compounded, non-overlapping price ratios. The tested model is specified as follows:
rt = α + β1rt-1 + β2rt-2 + β3rt-3 + … + β12rt-12 + εt
Where rt is the logged M/M price ratio of the S&P 500 in the current month, calculated as LN(Pt / Pt-1), α represents structural upward market drift, β1 through β12 denote the lagged coefficients for months 1 through 12 and εt is the error term.
Verdict: What the Regression Statistics & ANOVA Table Say
The evidence suggests that lagged stock market returns contain detectable, albeit modest, information about subsequent returns. Specifically, past performance explains 3%, not 0%, of the variation in future performance. While history isn’t a crystal ball, it’s statistically relevant, which is a notable distinction.
Fortunately for macro strategists like me, these results also mean that the overwhelming majority (97%) of share price movements are driven by external information, such as the economy, earnings, monetary and fiscal policy, geopolitical events and other factors that can’t be explained by price action alone. Sorry, technicians (see the tables below).

Sources: WCG, 6/30/26. Notes: R2 = R square. SE = Standard error. ANOVA = Analysis of variance. df = Degrees of freedom. SS = Sum of squares. MS = Mean square. F = F statistic. SF = Significance F or the P-value of F. P-value = The probability of observing your results if the null hypothesis is true.
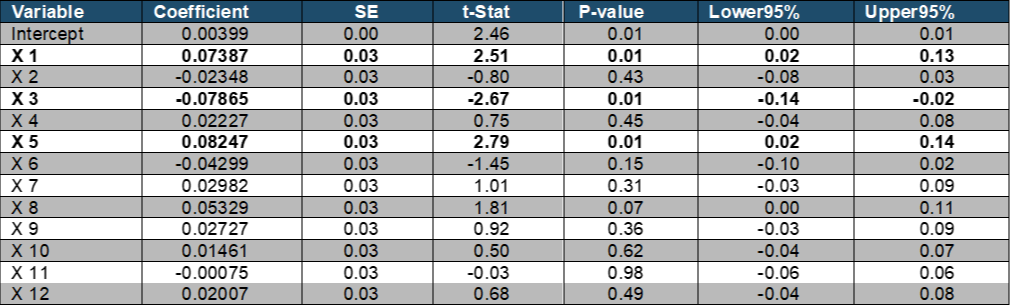
Sources: WCG, 6/30/26. Notes: t-stat = t statistic. Variables X 1-12 were lagged by 1-12 months, sequentially. Interval of estimation = Jan-1929 to Jun-2026.
History Matters
Not-So Supermodel (F-Statistic = 2.53 | Significance F = 0.00): With a high degree of certainty (p is less than 0.01), we can reject the null hypothesis that all lagged coefficients are simultaneously zero. The probability that the collective 12 months of past performance has no explanatory power is virtually non-existent. In other words, history isn’t just noise.
Structural Drift
Intercept (Coefficient = 0.00399 | P-value = 0.01 | t-Stat = 2.46): A positive intercept is consistent with the long-term uptrend of US large-cap stocks over the sample period. Plain English: Stocks seem to benefit from a structural, upward drift of 0.4% per month.
“Memory Lane” Hypothesis
While a given 12-month sequence of returns may be meaningful, the individual t-stats and P-values suggest that the stock market’s memory isn’t perfectly linear. Rather, an interesting wave pattern forms that requires further analysis. Specifically, the one-, three- and five-month lags emerge as statistically significant in this specification. Whether they represent stable features of stock market behavior, regime-dependent effects or statistical artifacts deserves additional scrutiny, but those are stories for another day:
- 1-Month “Momentum” (Lag 1)
o Coefficient = 0.07387 | P-value = 0.01 | t-Stat = 2.51
o A positive coefficient at the one-month horizon points to serial correlation (or autocorrelation), short-term trend persistence and tactical momentum. Plain English: Last month’s performance could spill over into this month.
- 3-Month “Reversal” (Lag 3)
o Coefficient = -0.07865 | P-value = 0.01 | t-Stat = -2.67
o A negative coefficient at the three-month horizon implies a potential “rubber band” effect or quarterly “mean reversion.” Plain English: Performance from three months ago may drag on this month.
- 5-Month “Echo” (Lag 5)
o Coefficient = 0.08247 | P-value = 0.01 | t-Stat = 2.79
o A positive coefficient at the five-month horizon suggests a secondary wave of positive momentum that resurfaces nearly half a year later. Plain English: Performance from almost two quarters ago can have a “ripple” effect on this month.
Every other lag (months 2, 4 and 6-12) fails the standard significance test (p > 0.05).
Bottom Line
The hedge clause, “Past performance does not guarantee future results,” is true but statistically incomplete. The evidence is consistent with a stock market memory that persists modestly and unevenly across time horizons, although additional testing is required to determine whether this pattern is stable across market regimes. These findings suggest that historical returns may contain incremental information that could complement broader investment frameworks.
While compliance guidelines treat equity trends as decoupled sequences, my quantitative approach follows a long lineage of academic literature. To wit, the seminal work of Lo and MacKinlay (1988) pioneered the formal mathematical rejection of the “random walk” hypothesis for US stock prices, and Jegadeesh and Titman (1993) documented the enduring structural presence of short-term serial return dependencies.
References
Jegadeesh, N., & Titman, S. (1993). Returns to Buying Winners and Selling Losers: Implications for Stock Market Efficiency. The Journal of Finance, 48(1), 65-91.
Lo, A. W., & MacKinlay, A. C. (1988). Stock Market Prices Do Not Follow Random Walks: Evidence from a Simple Specification Test. Review of Financial Studies, 1(1), 41-66.
Portfolio Strategy
by Jim Worden, CFA®, CMT®, CAIA®, Chief Investment Officer
July 2, 2026
Human beings are notoriously good at looking ahead and trying to extrapolate the next month, three months, six months, one year, and possibly further. I don’t mean that we’re accurate at it - at least, not most of us. One reason may be that we tend to take the most recent experiences and project them forward. If something bad recently happened, we may incorrectly think that there’s still more bad coming. Often there is, but often the worst is already behind us. This can be true with the economy, the markets, and other areas. Some analytical types think the opposite - if something really bad happened, it likely won’t happen again for a very long time. That could be true, or it could be false. Sometimes, things cluster.
But for many, if things are going great, they may think things will continue to be great. And often they stay great for a period. As someone who studies things like momentum and trend, there is truth to the idea that things can continue to go in one direction if they are already going in that direction.
We encounter those who can always see a silver lining in whatever bad thing is happening - war, a recession, higher interest rates, job losses, etc. These people are often fun to be around because they are always optimistic, even when things look dire.
Now, enter the “glass is always nearly empty” type. Everything is always on the down, never on the up. Valuations are always too rich. The economy is always on the brink of collapsing. And if that wasn’t enough, we’re going to run out of fuel, and we’ll all starve due to a lack of food and other resources.
Somewhere in between the “everything is awesome” and “we’re all going to die soon” narrative lies reality. The media, by the way, loves to go with whatever headline sizzles and attracts eyeballs, for good or for bad.
Given where we are at the halfway point in 2026, here are some of my thoughts on the markets and the economy, categorized based on Clint Eastwood’s classic:
The Good
- Revenue, margins, and earnings are all trending higher
- Consumer and corporate balance sheets are, in aggregate, healthy
- Money market fund assets are roughly $7.9 trillion1
- The labor market is not weakening as much as I expected
- Oil prices have come down sharply, and gas prices will likely follow
The Bad
- Valuations are getting stretched in some areas. SanDisk (SNDK, we don’t own it) now has a forward price/sales ratio of 17x. A year ago, it was less than 0.8x. SNDK is up more than 4,900% over the last year.2
- Demand for high-bandwidth memory (HBM) to build AI data centers continues to crowd out supply for other memory, which is now spiking due to shortages, ultimately impacting consumers.
- The Fed could raise rates if inflation stays too elevated.
The Ugly
- Parabolic price movements higher can sometimes foreshadow parabolic price drops - a melt-up followed by a meltdown. This is especially true if valuations are already stretched.
- The lower part of the “K” in the “K-shaped” economy is still struggling. Homes are not affordable for many new households. Lower-income families may not see easing financial conditions or lower rates from the Fed due to inflation not coming down enough.
- Sentiment, while improving, is still near record lows. Though some clients may be happy with their portfolio returns, the mood is still one of malaise for some.3
- Bonds are essentially flat year-to-date. More conservative investors might be wishing they had stayed with a little more in equities in hindsight.4
Where do we go from here?
We continue to like smaller companies and international equities as part of a diversified portfolio where larger companies are the core of the portfolio. We like growth, but we also like value. In our quant-driven portfolios, where we can be slightly more tactical and manage the exposures more actively, we have increased our exposure to communication services, consumer discretionary, and consumer staples, with slight increases in financials, healthcare, and real estate. We have reduced exposure to technology and industrials, with a slight decrease in utilities.
We continue to believe that the S&P 500 has a path to hit 8,500 by year-end. This will largely depend on the following, in my opinion:
- Breadth continues to stay above 60% for both the S&P 500 and Russell 2000
- The parabolic swings stay limited to a few pocket areas. A widespread melt-up might see 8,500, only to retreat sharply to much lower technical support.
- CAPEX in technology stays hot throughout the rest of the year and stays high well into next year. This will allow margins to stay elevated for longer and for multiples to stay stable as prices move higher.
- Inflation stays low enough for the Fed not to raise rates.
- Existing conflicts wind down and no new conflicts emerge.
- The 10-year Treasury yield stays range-bound below 4.8%.
Source notes
1. $7.9 trillion as of 6/24/26. Sources: Bloomberg and ICI.
2. SNDK valuation and return data: Bloomberg, as of 7/1/26.
3. University of Michigan Consumer Sentiment was 49.5 as of 6/30/26. Source: Bloomberg.
4. Bloomberg U.S. Aggregate Bond TR Index: +0.62% YTD as of 7/1/26. Source: Bloomberg.
Definitions
Random walk: A mathematical process where future steps or values are completely unpredictable and determined by pure chance. In finance, it represents the theory that stock price movements are random and cannot be predicted using historical data.
Autoregressive model: A statistical model that predicts future values of a variable by looking at its own past values. It uses a linear combination of previous data points to forecast the next step in a time series.
Natural logarithm: A mathematical function that represents the power to which the constant e (approximately 2.718) must be raised to equal a specific number. It is widely used in finance and science to model continuous growth or compounding returns.
S&P 500: A stock market index that tracks the performance of 500 of the largest companies listed on stock exchanges in the United States. It is widely used as a reliable gauge for the overall health of the US stock market.
Spurious: A term describing a statistical relationship where two variables appear to be causally linked but are actually unrelated. This false connection is usually a coincidence or driven by a hidden third variable.
Regression: A statistical method used to estimate and analyze the relationship between a dependent variable and one or more independent variables. It helps determine how much the dependent variable changes when an independent variable is modified.
ANOVA: A statistical test used to compare the means of three or more independent groups. It determines if at least one group mean is significantly different from the others.
Serial or auto correlation: A statistical phenomenon where error terms or data points in a time series are correlated with their own past values over time. It indicates that past patterns are repeating in the data.
Momentum: An investment factor or market characteristic in which securities or markets that have recently performed well may continue to perform well for a period, though reversals can occur.
Trend: The general direction of a market, security, sector, or economic data series over a period of time.
Valuation: An assessment of whether a security, sector, or market appears expensive or inexpensive relative to fundamentals such as earnings, revenue, cash flow, or assets.
Forward price/sales ratio: A valuation measure that compares a company’s market value or share price to expected sales over a future period. A higher ratio may indicate higher growth expectations, richer valuation, or both.
High-bandwidth memory (HBM): A type of computer memory designed to move large amounts of data quickly, commonly used with advanced processors and artificial intelligence infrastructure.
AI data centers: Facilities that house computing infrastructure used to train, run, and support artificial intelligence systems.
Money market funds: Investment funds that generally invest in short-term, high-quality debt instruments. They are not bank deposits and are not guaranteed by the FDIC.
Federal Reserve (Fed): The central bank of the United States, responsible for monetary policy, including decisions that influence short-term interest rates.
K-shaped economy: A description of an economy in which different groups, sectors, or asset classes experience materially different recoveries or outcomes.
Parabolic price movement: A rapid and accelerating price increase that may be difficult to sustain and may be vulnerable to sharp reversals.
Melt-up / meltdown: A melt-up is a sharp market advance often driven by momentum, sentiment, or fear of missing out. A meltdown is a sharp market decline.
Market breadth: A measure of how many securities are participating in a market move, such as the percentage of stocks above a moving average or advancing versus declining.
S&P 500: A market-capitalization-weighted index of 500 large U.S. companies and a common benchmark for large-cap U.S. equities.
Russell 2000: An index commonly used to measure the performance of small-cap U.S. equities.
CAPEX: Capital expenditures, or spending by companies on long-term assets such as property, equipment, infrastructure, or technology.
10-year Treasury yield: The yield on U.S. government debt maturing in 10 years. It is commonly used as a benchmark for interest rates and borrowing costs.
Bloomberg U.S. Aggregate Bond Index: A broad benchmark for the U.S. investment-grade taxable bond market, commonly used to represent core bond market performance.
University of Michigan Consumer Sentiment Index: A monthly survey-based measure of consumer confidence, including consumers’ views of current economic conditions and expectations for the future.
Disclosures
This material is for informational and educational purposes only and should not be construed as individualized investment advice, a recommendation, or an offer to buy or sell any security, strategy, or investment product.
The views expressed are opinions as of the date written and are subject to change without notice. Forward-looking statements, including market or index targets, are not guarantees of future results. Actual outcomes may differ materially from expectations.
Investing involves risk, including the possible loss of principal. Equity investments are subject to market risk, sector risk, and company-specific risk. Smaller companies, international equities, growth stocks, value stocks, and sector-specific investments may involve additional risks.
Fixed income investments are subject to interest rate risk, credit risk, inflation risk, and reinvestment risk. Bond prices generally fall when interest rates rise.
Diversification and asset allocation do not guarantee a profit or protect against loss in declining markets.
Indexes are unmanaged and cannot be invested in directly. Index performance does not reflect the deduction of fees, expenses, or taxes.
References to specific securities are for illustrative purposes only and should not be interpreted as recommendations. Holdings and opinions may change at any time. The author or affiliated clients may or may not hold positions in the securities discussed.
Past performance is not indicative of future results.
Data and factual information should be verified against the cited source and as-of date before publication. Third-party data is believed to be reliable but is not guaranteed for accuracy or completeness.
Money market funds are not insured or guaranteed by the FDIC or any other government agency. Although many money market funds seek to preserve the value of an investment at $1.00 per share, it is possible to lose money by investing in a money market fund.
This material does not provide tax, legal, or accounting advice. Consult the appropriate professional regarding individual circumstances.
This material is for informational and educational purposes only and should not be construed as individualized investment advice, a recommendation, or an offer to buy or sell any security or investment product.
The views expressed are opinions as of the date noted and are subject to change without notice as market and economic conditions evolve.
Past performance is not indicative of future results. Investing involves risk, including the possible loss of principal.
Index returns are unmanaged and do not reflect fees, expenses, or taxes. Investors cannot invest directly in an index.
Technical analysis, moving averages, trend scoring, and market-breadth measures are tools that may be used as part of an investment process, but they do not guarantee future performance or protect against loss.
The chart review described is a subjective screening process and should not be viewed as a complete investment analysis. It does not, by itself, account for all relevant fundamental, valuation, liquidity, tax, or client-specific suitability considerations.
Data is believed to be reliable but is not guaranteed. Sources referenced in the piece include Bloomberg, Morningstar, the University of Michigan Surveys of Consumers, and money market fund industry data. Figures should be verified before publication.
References to dividends, lower volatility, or lower beta do not imply safety, guaranteed income, or protection from market losses. Dividends are not guaranteed and may be increased, reduced, or eliminated at any time.
Statements regarding potential upside, market direction, or future performance are opinions, not guarantees. Actual results may differ materially from expectations.
The views expressed are for informational and educational purposes only and are subject to change without notice.
This material is not intended as, and should not be interpreted as, individualized investment advice or a recommendation to buy, sell, or hold any security, sector, industry, or investment strategy.
References to specific companies, securities, sectors, or industries are for illustrative purposes only and should not be construed as investment recommendations.
Investing involves risk, including the possible loss of principal. Investments in a specific industry or sector may involve greater risk and volatility than more diversified investments.
Past performance is not indicative of future results. No investment strategy can guarantee a profit or protect against loss.
Forward-looking statements, including views about future demand, pricing, supply, or industry cycles, are based on current expectations and assumptions and are subject to risks and uncertainties. Actual results may differ materially.
Data and information are believed to be reliable, but accuracy, completeness, and timeliness are not guaranteed. Source documents should be retained for factual claims, third-party research references, and company-specific data.
Portfolio holdings, allocations, and risk budgets are subject to change based on market conditions, client objectives, and investment guidelines.
The author, firm, clients, or related persons may hold positions in securities mentioned and may buy or sell those securities without notice, subject to applicable policies and regulations.
Securities offered through LPL Financial, Member FINRA/SIPC. Investment Advice offered through WCG Wealth Advisors, LLC, an SEC Registered Investment Advisor. WCG Wealth Advisors, LLC and The Wealth Consulting Group are separate entities from LPL Financial. Index performance is shown for illustrative purposes only and does not predict or depict the performance of any investment. Past performance does not guarantee future results.
All information in this report is believed to be from reliable sources; however, WCG Wealth Advisors, LLC, makes no representation as to its completeness or accuracy.
In general, stock values fluctuate, sometimes widely, in response to activities specific to the companies as well as broad market, economic and political conditions. Stock investing involves risks, including fluctuating prices and loss of principal. Value investments can perform differently from the market as a whole. They can remain undervalued by the market for long periods of time. (135-LPL) International investing involves special risks such as currency fluctuation and political instability and may not be suitable for all investors. These risks are often heightened for investments in emerging markets. (93-LPL)
Bonds are subject to market and interest rate risk if sold prior to maturity. Bond values will decline as interest rates rise. Bonds are subject to availability, change in price, call features and credit risk. (116-LPL)
The fast price swings in commodities will result in significant volatility in an investor’s holdings. Commodities include increased risks, such as political, economic, and currency instability, and may not be suitable for all investors. (122-LPL)
Rebalancing a portfolio may cause investors to incur tax liabilities and/or transaction costs and does not assure a profit or protect against a loss. (28-LPL)
There is no guarantee that a diversified portfolio will enhance overall returns or outperform a non-diversified portfolio. Diversification does not protect against market risk. (26-LPL)
Standard deviation is a historical measure of the variability of returns relative to the average annual return. If a portfolio has a high standard deviation, its returns have been volatile. A low standard deviation indicates returns have been less volatile. (131-LPL)
This is for educational / general purposes only, does not constitute investment, tax or legal advice and should not be relied on as such. This is not to be construed as an offer to buy or sell any financial instruments. Any strategies discussed are not intended to be relied upon as the sole factor in making an investment decision for any individual. As with all investments there are associated inherent risks. Please obtain and review all financial material carefully before investing. All material presented is compiled from sources believed to be reliable and current, but accuracy cannot be guaranteed. The opinions voiced in this material are for general information only and are not intended to provide specific advice or recommendations for any individual. All performance referenced is historical and is no guarantee of future results. All indices are unmanaged and may not be invested in directly. These comments should not be construed as recommendations but as an illustration of broader themes.
Forward-looking statements are not guarantees of future results. They involve risks, uncertainties and assumptions; there can be no assurance that actual results will not differ materially from expectations. In addition, forward-looking statements, including index targets or market scenarios, are hypothetical in nature, reflect current views and assumptions and are subject to change based on market and economic conditions and are not guarantees of future performance. This is a hypothetical example and is not representative of any specific investment. Your results may vary. (88-LPL) Scenario outcomes are illustrative and not predictive. This does not constitute a recommendation of any investment strategy or product for a particular investor. Investors should consult a financial professional before making any investment decisions.
The S&P 500 is a stock market index tracking the stock performance of 500 of the largest companies listed on stock exchanges in the United States. Indexes are unmanaged and cannot be invested in directly. (102-LPL)
Government bonds and Treasury bills are guaranteed by the US government as to the timely payment of principal and interest and, if held to maturity, offer a fixed rate of return and fixed principal value.
Publication Date: July 2, 2026
For Public Use in the US
The Wealth Consulting Group
LPL 1134167